History Section
Accessing Your Test History
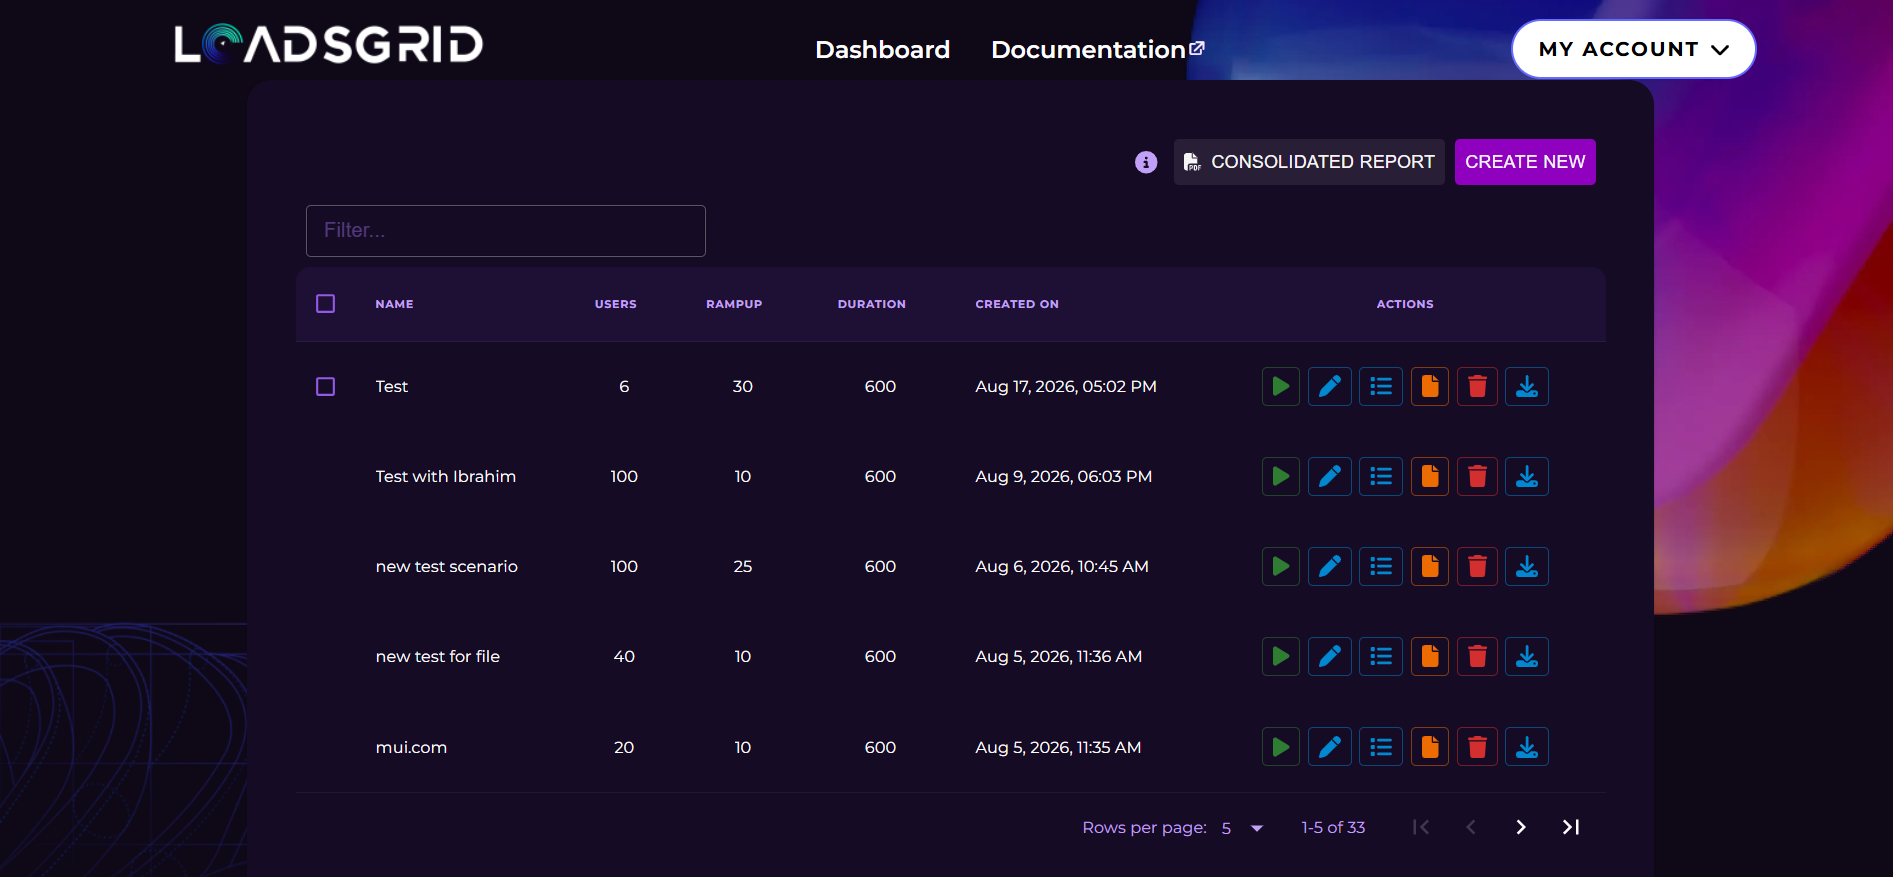
After creating a test, you can easily track its usage by clicking the ☰ History button in the Actions column. This will provide you with valuable insights into your test activities.
Viewing Historical Data
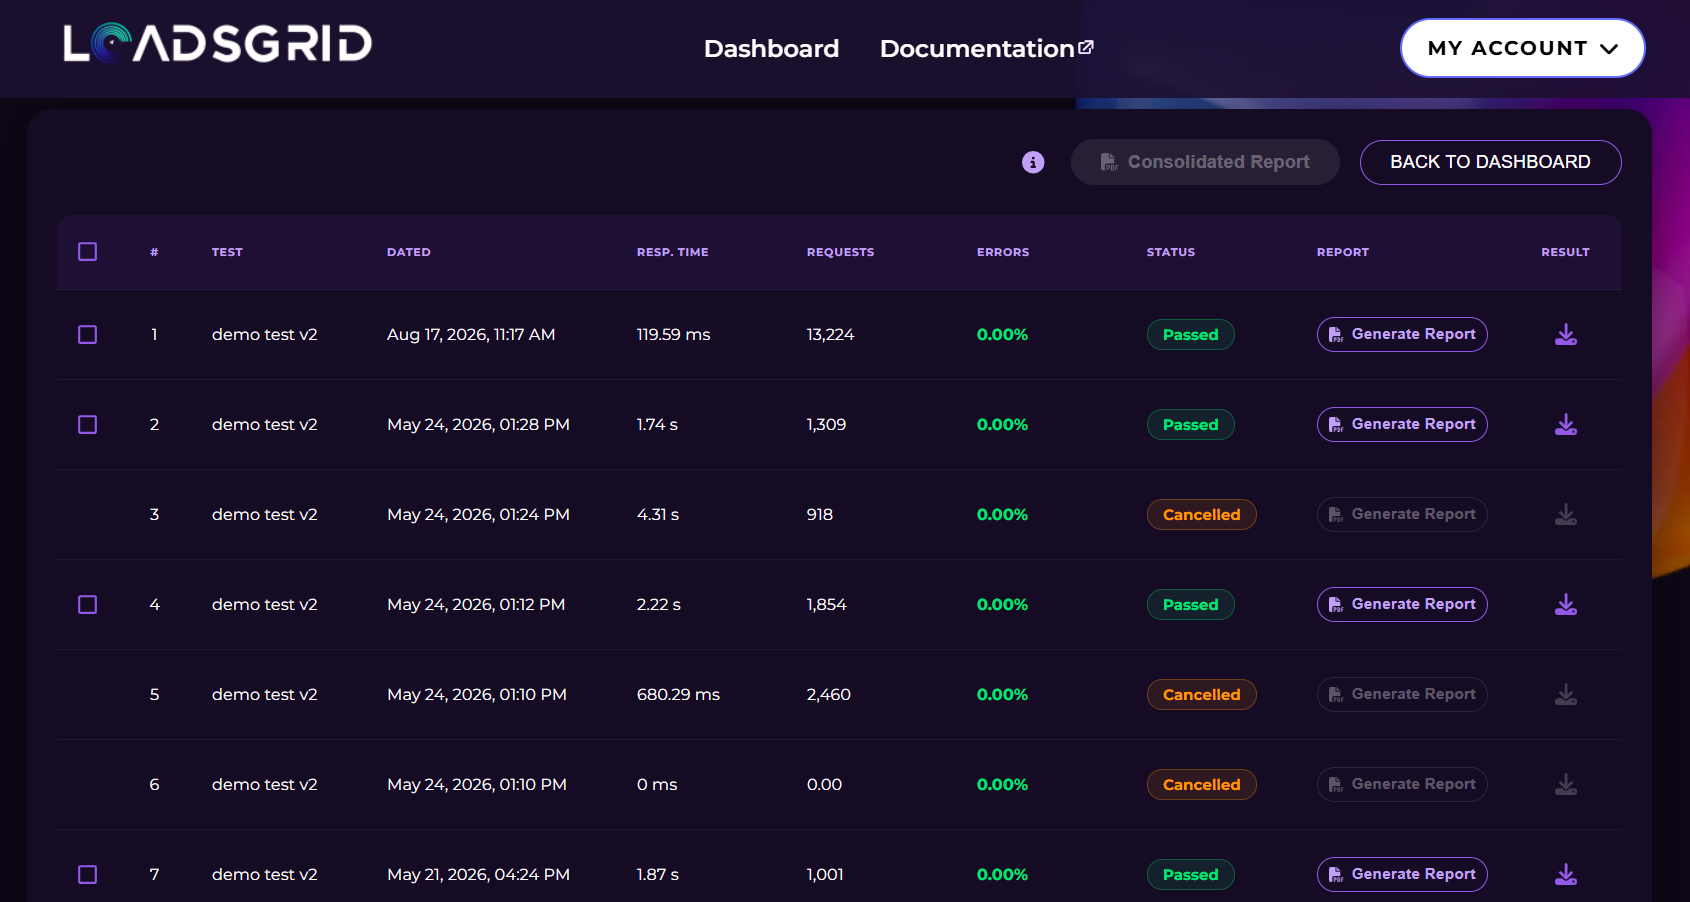
Clicking History takes you to the history page, which lists every execution of that test with its key numbers:
| Column | Meaning |
|---|---|
| Dated | When the execution started, in your local time. |
| Resp. Time | The average response time of the run. |
| Requests | The total number of requests the run produced. |
| Errors | The error rate of the run, in percent. |
| Status | The outcome of the run — see below. |
| Report | Generates an AI report for that single run. |
| Result | Downloads the result of that run. |
Run Status
The Status badge is based on the SLA you set on the test:
- Passed — the run stayed within both SLA limits.
- Failed — the error rate or the average response time exceeded the SLA, or the run produced no requests at all.
- Cancelled — the run was stopped before it finished.
- Processing / Finalizing — the run is still in progress or its results are still being collected.
Cancelled runs and runs with no requests have no result and no report, so their Report button and Result icon are inactive.
Examining Test Results
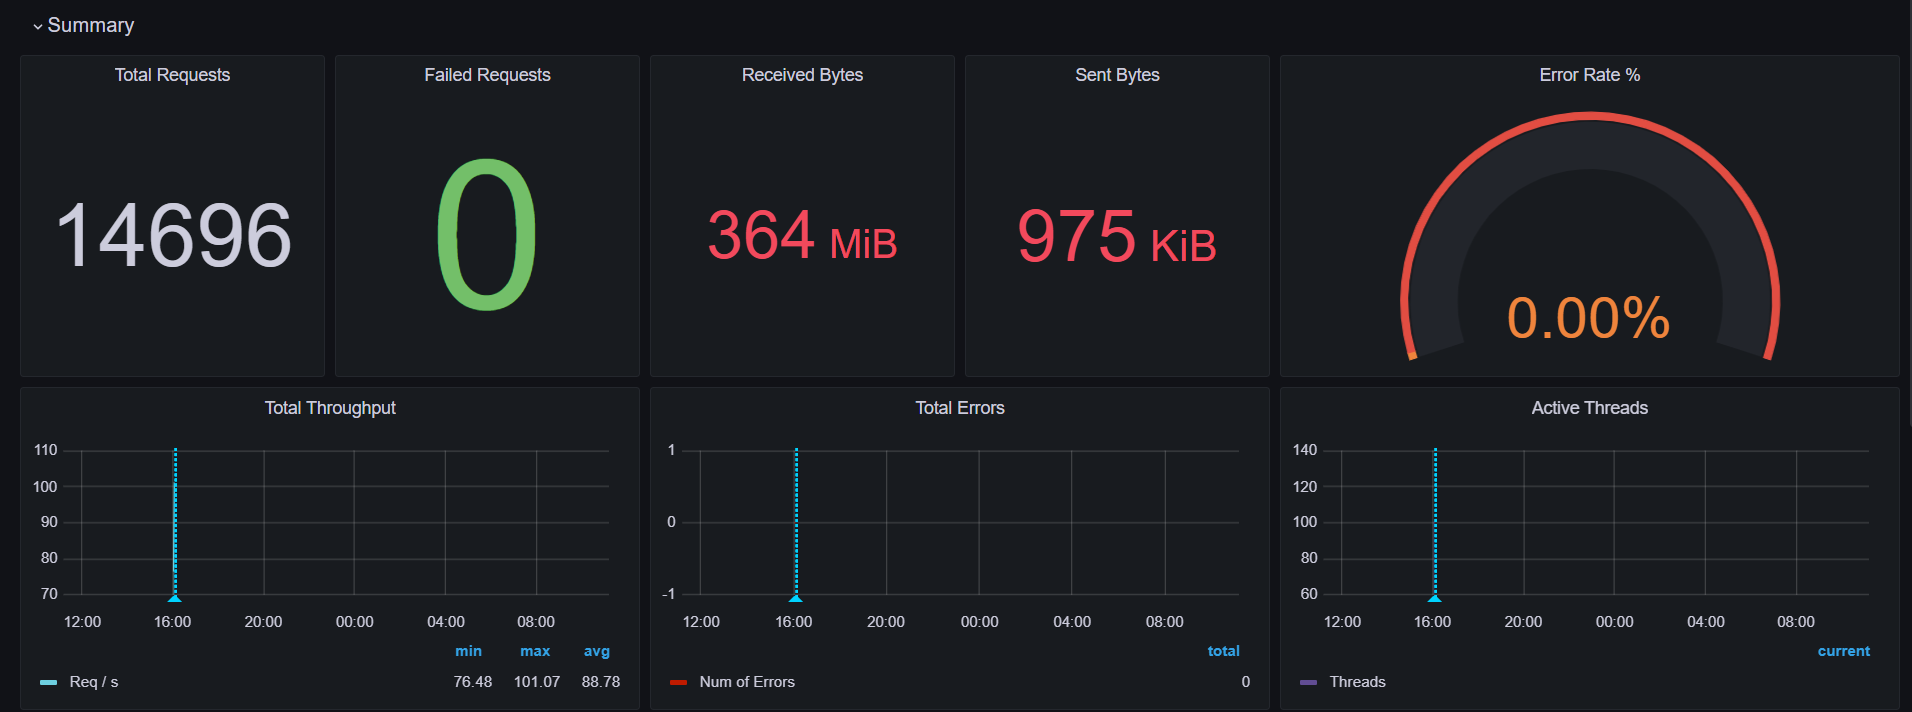
To look deeper into any run, click the Download the result icon in the Result column. You will be presented with the results of that execution, showing performance metrics and the data captured during that session.
Generating AI Reports
Note: This feature is exclusive to Enterprise Users.
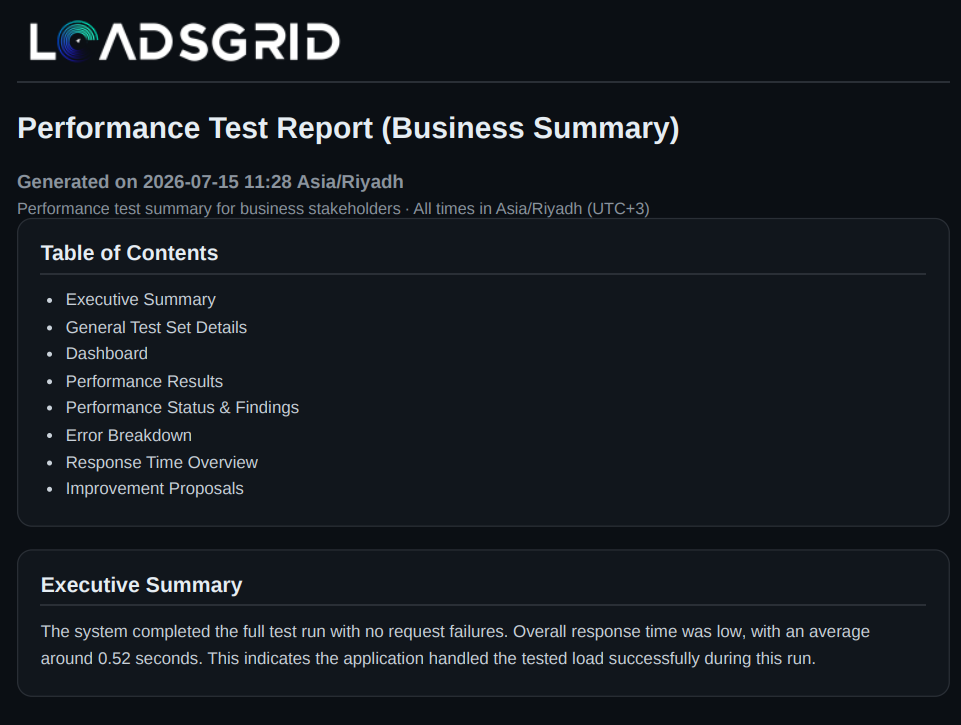
Our platform provides an AI-driven report generation tool that analyzes your test runs and creates an executive summary of performance metrics, insights, and improvement proposals.
To generate a report for a specific run, click the Generate Report button in the corresponding row. Generation takes a while — the button reports its progress. When the report is ready, you can either view it in your browser or download it as a PDF.
Consolidated Report
Above the table, next to Back to Dashboard, sits the Consolidated Report button. It produces a single AI-driven executive summary that compares several runs of this test side by side, instead of one report per run.
Selecting Runs
Tick the checkbox of each execution you want to include. You can select between 2 and 8 runs.
Only executions that produced results can be ticked — cancelled runs and runs with no requests have no checkbox at all, because they cannot generate a report. The ⓘ icon next to the button repeats this rule.
Generating the Report
Once at least two runs are ticked, the button becomes active and shows how many are selected, for example Consolidated Report (3). Click it and a window — Executions included in this report — lists the runs with their dates so you can check the selection before starting.
Generation takes a while; the button shows Generating consolidated report... meanwhile. When the report is ready you can either View in Browser or Download PDF.
If the selection is not valid — fewer than 2 or more than 8 runs — a message at the bottom of the screen explains what to fix.
This compares several runs of the same test. To compare different tests with each other, use the Consolidated Report button on the dashboard, which takes the latest completed run of every test you select.